Next | Prev | Up | Top | Contents | Index
Achieving Accurate Benchmarking Results
To benchmark performance for a particular code fragment, follow these steps:
- Determine how many polygons are being drawn and estimate how many pixels they cover on the screen. Have your program count the polygons when you read in the database.
To determine the number of pixels filled, start by making a visual estimate. Be sure to include surfaces that are hidden behind other surfaces, and notice whether or not backface elimination is enabled. For greater accuracy, use feedback mode and calculate the actual number of pixels filled.
- Determine the transform and fill rates on the target system for the mode settings you are using.
Refer to the product literature for the target system to determine some transform and fill rates. Determine others by writing and running small benchmarks.
- Divide the number of polygons drawn by the transform rate to get the time spent on per-polygon operations.
- Divide the number of pixels filled by the fill rate to get the time spent on per-pixel operations.
- Measure the time spent executing instructions on the CPU.
To determine time spent executing instructions in the CPU, perform the graphics-stubbing experiment described in "Isolating Bottlenecks in the Pipeline: Overview".
- On high-end systems where the processes are pipelined and happen simultaneously, the largest of the three times calculated in steps 3, 4, and 5 determines the overall performance. On low-end systems, you may have to add the time needed for the different processes to arrive at a good estimate.
This process takes some effort to complete. In practice, it's best to make a quick start by making some assumptions, then refine your understanding as you tune and experiment. Ultimately, you need to experiment with different rendering techniques and do repeated benchmarks, especially when the unexpected happens.
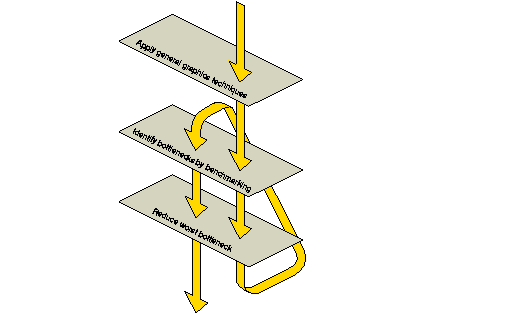
Verify some of the suggestions presented in the following chapter. Try some techniques on a small program that you understand and use benchmarks to observe the effects. Figure 11-2 shows how you may actually go through the process of benchmarking and reducing bottlenecks several times. This is also demonstrated by the example presented in Chapter 13, "Tuning Graphics Applications: Examples."

Figure 11-2 : Flowchart of the Tuning Process
Next | Prev | Up | Top | Contents | Index

